Unraveling Our Tight Housing Market: People and Populations
Share News:
Listening to experts discuss the state of the US housing market at the National Association of Real Estate Editors’ conference last week, two large forces were evident … people trends and building trends. Put together, we have a good picture of what’s going on in housing. But within these large buckets, there remains a lot of nuance to unpack. This first installment will cover people and population trends.
Population and Housing
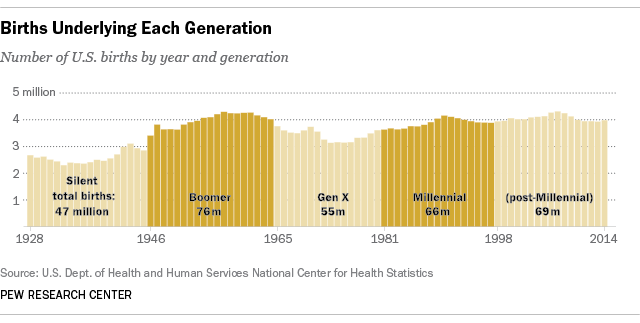
Population is broken into manageable, marketable pieces called “generations,” reflected in the graphic above that reports the number of births in a given generation. Unfortunately for statisticians, the generations are not of equal duration. One reason the Baby Boomers became the largest was that, as a generation, it’s up to three years the longer and also coupled with a period of increased birth rates. By contrast, the poor Gen X-ers had lower birth rates but also the shortest “generation” timespan … a double whammy. Had Gen-X been as long as the Boomers, it would have had roughly the same birth size as the Millennials.
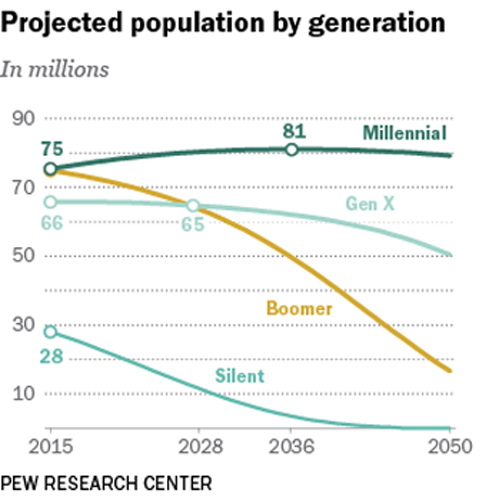
But just using U.S. births as a measurement of generational population doesn’t tell the whole story. There were 76 million Boomer births, yet the Boomer population peaked in 1999 at 78.8 million. How did the Boomer population grow beyond its birth rate? Immigration. Given that over 11 million Boomers have died, how can there still be 74 million Boomers left today? Immigration increased quicker than the Grim Reaper could take. It’s why the Millennials are forecast to grow to 81 million by 2036 even though their generation ended in 1998 with 66 million total births.
Further impacting housing are the increasing numbers of single households. Within the Boomer population from 1980 to 2009, unmarried 45- to 63-year-olds jumped from 22 to 34 percent (and continuing to increase). Also, while a gender longevity gap remains, it’s been sliced in half since 1980 with unmarried female households now accounting for just 6 percentage points more than men. Divorce is the chief avenue to singledom, with about a quarter of all divorces occurring after age 50 (blame increased longevity).
Immigration
I am not going to debate the immigration issue. However, any debate needs to include the contributions made to our society and population. Without immigrants, the U.S. and Texas economies would be noticeably smaller. Speaking for Texas, at least since 1980, our foreign born population percentage has been higher than the national average, growing from 7.6 percent in 1980 to approximately 20 percent since 2000. Any sustained outflow of immigrants would significantly impair the state’s economy.
Specific to the Metroplex, according to the Partnership for a New American Economy, the Metroplex has 1.23 million immigrants or 17.7 percent of the area population. They pay $8.4 billion in taxes based on $25.5 billion in earnings. Of the 1.23 million, 87,000 run their own businesses.
Part of the Metroplex’s tight housing market is due to a lack of construction labor. In Texas, 46.3 percent of immigrants work in construction trades with a further 29.7 percent in manufacturing. The current state and federal governments’ rhetoric and regulation on immigration directly hurts the Texas housing market by making housing more expensive. Sure, were we to chase immigrants away, their abandoned housing would free up housing and reduce prices, but at what cost to the broader economy?
Another wrinkle is the fact that 77 percent of foreign-born immigrants are between 25 and 64 years old … prime working years. On another note, as the population ages, they (we?) need more care. A plethora of intermediate healthcare is provided by immigrant labor. Each morning a small army of caregivers arrives in my high-rise. Of course, the irony being it’s the older generations that are often the most anti-immigrant.
In immigrant-dependent geographies, removing or drastically curtailing the immigrant labor force would have disastrous effects on housing and healthcare. For example, Brexit has seen monthly applications from EU-trained nurses drop 96 percent from 1,304 in July 2016 to 46 in April 2017. The UK’s National Health Service foresees a shortage of 40,000 nurses as a result of Brexit.

Cultural Housing Drivers
Interestingly, like many social issues, cultural prejudice weakens with younger generations through exposure that brings acceptance. For example, only 22 percent of the U.S. population over age 65 is comprised of non-Caucasians … but … within the Millennial generation, it’s currently 44 percent. For those under 5 years old, the number reaches just over half. Overall, at the dawn of the millennium, 33 percent of the U.S. population was non-Caucasian that by 2014 had shifted to 38 percent. Social evolution is definitely a young person’s game.
While Texas’ main immigration source remains Mexico, nationally, China has overtaken Mexico in total numbers. Statewide, 71 percent of unauthorized immigrants are from Mexico but all unauthorized immigrants are just 35 percent of the total immigrant population, and a minuscule 6.1 percent of the total Texas population.
Nationwide, the total population of Mexican immigrants has dropped by over 1.1 million since 2007 to 5.8 million. Apprehensions at borders plummeted from 1.6 million in 2000 to just 192,969 in 2016 … and Mexicans weren’t the largest nationality being caught. In fact, Mexican inflows to the U.S. have continued to drop even after the effects of the Recession are cast off. Also, in 2014, a full 78 percent of unauthorized Mexican immigrants have been here over 10 years while just 7 percent had arrived within the past five years.
In terms of housing, different cultures live differently. Asian and Latin cultures embrace multi-generational living more than traditional Euro-centric Caucasians. In fact, the 2017 Harvard University, The State of the Nation’s Housing study reports that 53 percent of Hispanics and Asians over 65 live in multi-generational homes compared to 31 percent of Blacks and 15 percent of Caucasians. If you’re foreign born, the number jumps to 65 percent for all non-Caucasians. In Hawaii, Asian cultural norms coupled with high-housing costs result in high-concentrations of multi-generational housing. As the U.S. matures numerically and culturally, multi-generational housing is being purpose-built to meet demands instead of only retrofitting existing homes.
But it would be simplistic to ascribe multi-generational housing trends solely to cultural influences. From 1980 until 2000, 17.6 to 18.6 percent of Metroplex residents 18 to 34 years old lived with a parent. The Recession stoked that to 27.9 percent as of 2013 and continues to grow. Nationwide, by 2014 just over 34 percent of 18 to 34 year olds lived with a parent … that’s 24 million people.
Part of that trend could be attributed to poverty and employment. Since 1980, the incidence of young adult Texans living in poverty has increased from 10 percent to 17.2 percent in 2013. Employment for the group has similarly dropped from 77.6 percent in 1980 to 69.5 percent in 2013 with average wage declines of $2,820 since 1980 to $33,369 annually.
Those not in real poverty are burdened by unprecedented levels of consumer and educational debt. Debt delays first housing purchases into mid-30s, as years are wasted getting debt under control. Today, 80 percent of people are married by aged 45 while in the 1970s 80 percent were married by age 30. Debt plays a significant role in this delay and explains why young Americans believe that education and economics are the milestones of adulthood while marriage and children take a back seat (to servicing debt).

Ethnicity and Homeownership
The chart above details homeownership rates between ethnicities over time. Assuming a starting point of 1994, we see that while Blacks made strides in homeownership, that momentum was reversed during the Recession and continues a decline, falling below 1994 levels. In fact, the Harvard study reports that Black homeownership dropped 7.5 percent during the period to 52.2 percent while Caucasians only dropped four percent to 71.9 percent. The delta between Caucasian and Black homeownership is at its widest since World War II.
From 2014 to 2016, Hispanics increased their homeownership rate by 0.8 percent, adding 5 points overall to 46 percent. Asians, while also off their 2006 highs, had homeownership rates in 2016 that were similarly up 5 percent overall. Today, these two groups represent 20 percent of homebuyers.
The chief reason for lower minority homeownership rates is ethnic income disparity coupled with the availability of affordable housing. As we’ll see in Part Two of this series, affordable housing starts have plummeted since the Recession as the recovery has focused on higher end homes and apartments.

Pulling this all together, ethnic homebuyers will become the driver of growth. Whites might be thinking “wha-what?” but think about it. The aging Caucasian population will either age-in-place or simply die, reducing their (our) outsized impact on home buying. Also, at nearly 72 percent homeownership, we’re pretty tapped out as a market. Seeing minority homeownership percentages in the 40s, the only way to go is up. Will governmental interference with immigration policies foul this up? Sure. But the effect will be to drop overall growth in households, it won’t send Caucasian numbers soaring. Minorities aren’t holding Caucasians back, but their exit would surely hurt everyone.
Conclusions
We’re darn lucky to have some of this mess. Think about it. What would the housing market look like if there were 10 percent more Millennials looking for a house instead of living with their parents? What would happen to housing prices if some part of the 46 percent of immigrant construction workers left (something we’re already seeing)? Sure, you’d have those construction worker homes, but is that a long-term solution for Millennial housing? And even if we decided we wanted to dump immigrants in favor of Millennials moving out of basements, what then? Native-born U.S. citizens aren’t procreating like they used to (married later, fewer kids), so long-term household growth would shrivel. Or would we adopt the sad campaigns of other countries who, thinking 7.5 billion humans isn’t enough, try to bribe citizens to have more children?
Then imagine the Boomers, currently the largest block of homebuyers. What if their numbers weren’t propped up by an influx of 13 million Boomer-aged immigrant replacements to offset their mortality rate? How about the Millennials who are targeted to add 15 million to their ranks through immigration?
It’s simplistic to think that fewer Boomers and immigrants would produce a brighter outlook for homebuyers. The issue is much more complicated than that. Those people add to the economy in multiple ways. For example, I’m one person, I collect a salary, pay taxes and (mostly) live in one home. But I spend that salary in ways that support a variety of government programs and businesses (economic impact). Were I not here, governments and businesses would be poorer. The economy would be different and smaller. Regardless of your political bent, I’m pretty sure that “Different and Smaller” isn’t your rallying cry for the United States.
Next time, we’ll talk about how home construction is adding to the problem.

Remember: High-rises, HOAs and renovation are my beat. But I also appreciate modern and historical architecture balanced against the YIMBY movement. If you’re interested in hosting a Candysdirt.com Staff Meeting event, I’m your guy. In 2016 and 2017, the National Association of Real Estate Editors has recognized my writing with two Bronze (2016, 2017) and two Silver (2016, 2017) awards. Have a story to tell or a marriage proposal to make? Shoot me an email [email protected].


Great Stuff!
A good understanding of demographics and one can predict the future, unfortunately its tough to get a really good grip on all the info. The breakouts can be confusing and there is often some lag as people re-locate.
.
One thing is for sure, every year everyone gets one year older and the human drive to procreate will eventually win out over whatever trends are pushed in the media. Households will be created !