Looking Back at Dallas: How Redlining Shaped the City
Share News:

Courtesy Kirwan Institute
This 1937 Home Owners’ Loan Corp. map of Dallas shows who could get a loan, and who couldn’t.
If the lending practices of the 1940s were still in place, would you have been able to get the mortgage you currently have? In some neighborhoods in Dallas, you’d be fairly confident in saying yes. But in others, the answer might surprise you.
A week ago, I was able to attend a workshop hosted by Children’s Medical Center and Ohio State’s Kirwan Institute about (in part) lending practices in the post-Depression era. Many of these practices openly continued until 1968, when they were forbidden by law. But they continue to shape and affect some neighborhoods even today.
But first, some history on home ownership prior to the Depression. Prior to the FDR era, home finance was not the standard 80/20 30-year mortgage we are all familiar with. Home ownership tended to be for the wealthy, or those who could afford variable rates, very high down payments and short terms. Many renegotiated their mortgage every year. Many also were faced with a large balloon payment at the end of the loan.
Partly in a bid to create steady work for construction sector and partly to address pressure placed on the housing market by banks reselling foreclosures (nearly 10 percent of all homes were in foreclosure at the height of the Depression and around 250,000 homes per year were foreclosed upon between 1931 and 1935), the federal government stepped in to modify the business of financing a home.
One of the results of that intervention was the Home Owners Refinancing Act of 1933, which created the Home Owners’ Loan Corporation, or HOLC. The HOLC raised funds through government-backed bonds, purchased the defaulted mortgages and then reinstated them. The agency also changed the terms for mortgages entirely, creating the mortgage as we know it now – fully amortized mortgages that were fixed rate and long term.
On the surface, this is great – now home ownership is available to many more people, for the down payment is lower, the monthly payment dependable, and no balloon payments. And this is how it worked – unless you were black.

Courtesy Kirwan Institute
Notice “type of population” is one of the factors that earned this neighborhood a redlined status (click to enlarge).
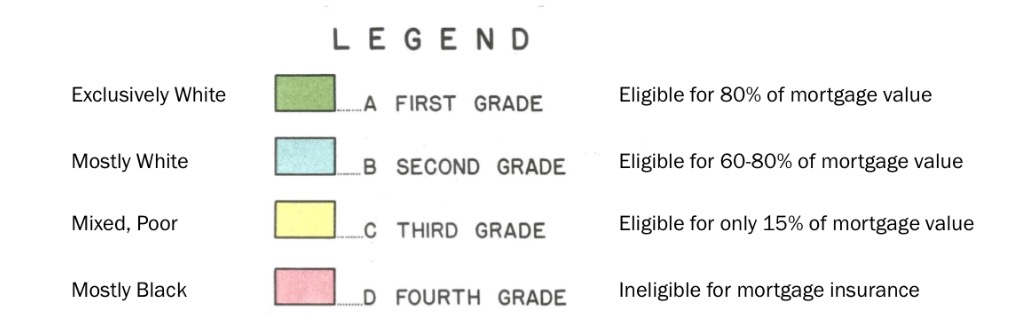
In order to determine how the Federal Housing Authority (which was created in part to guarantee mortgages) would determine how much risk it would assume on a mortgage, the HOLC assessed neighborhoods. Maps were colored in – green was a first grade area, which meant that home buyers would be able to qualify for a loan that would be guaranteed by the FHA for up to 80 percent, meaning you only needed 20 percent down. Blue meant you were in a B area, or second grade, and would qualify for 60-80 percent. Yellow was a C, or third grade, and would only qualify for 15 percent (which means you’d need to put up 85 percent down). Any area shaded with angry red lines – aka redlining – would not qualify for any loan.
Green areas were exclusively white, Anglo and Protestant. Blue areas were mostly white, but were other ethnic origins like Jews, Italians, and Irish, but still upwardly mobile. Yellow areas were a mix of ethnicities – including black – and poor. Redlined areas were almost exclusively black.
“The purpose of the Residential Security Map,” the HOLC explained in accompanying documentation to a 1937 map of Dallas, “is to graphically reflect the trend of desirability in neighborhoods from a residential viewpoint. Four classifications are used as indicated by the legend, namely: First, Second, Third and Fourth grades. The code letters and colors are A, B, C, and D and Green, Blue, Yellow and Red respectively. In establishing the grade of an area, such factors are considered: intensity of the sale and rental demand; percentage of home ownership; age and type of building; economic stability of area; social status of the population; sufficiency of public utilities; accessibility of schools, churches and business centers; transportation methods; topography of area; and the restrictions set up to protect the neighborhood. The price level of the home is not the guiding factor.” (Italics and bolding added.)
Restrictions, by the way, were clauses written into the title of the home that forbade the sale to non-whites. To this day, some homeowners are surprised to find them on their titles (those that like reading the entire cotton picking thing). At least a handful of times Dallas homeowners have actually told me they were shocked to find their home had such a clause. Those “covenants” are now unenforceable, which is likely why so many have no idea it’s even there.
Homer Hoyt, the chief economist at the FHA at the time (who also was charged with helping create the standards for the HOLC maps) further explained, “If the entrance of a colored family into a white neighborhood causes a general exodus of white people, such dislikes are reflected in property values.”
Redlined areas in Dallas were essentially cut off from credit. People who could afford to left the area. Few could. Lack of financing prospects cut off business growth in the area, creating food deserts and opportunity gaps that exist still today.
Redlining gave rise to another practice as well, as shady lenders would offer usurious and illegal loans to black families wishing to own homes, since they were unable to buy anywhere but redlined areas and were unable to get traditional bank loans. These loan terms were often designed to actually turn the home over repeatedly through eviction since often missing a payment or paying late just once would allow the lender to foreclose.
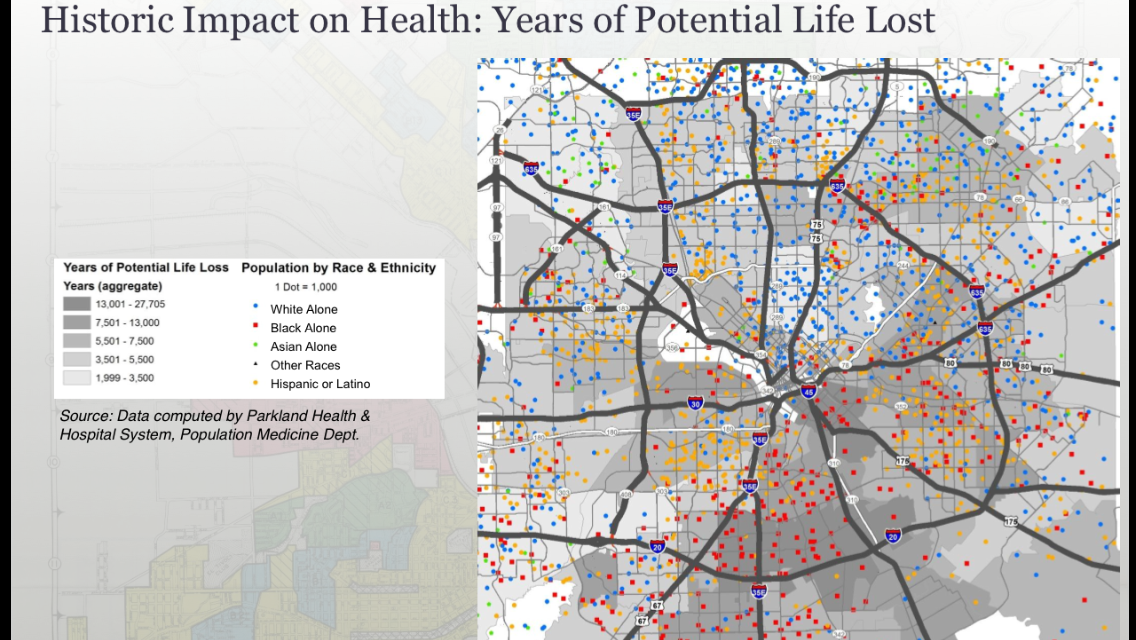
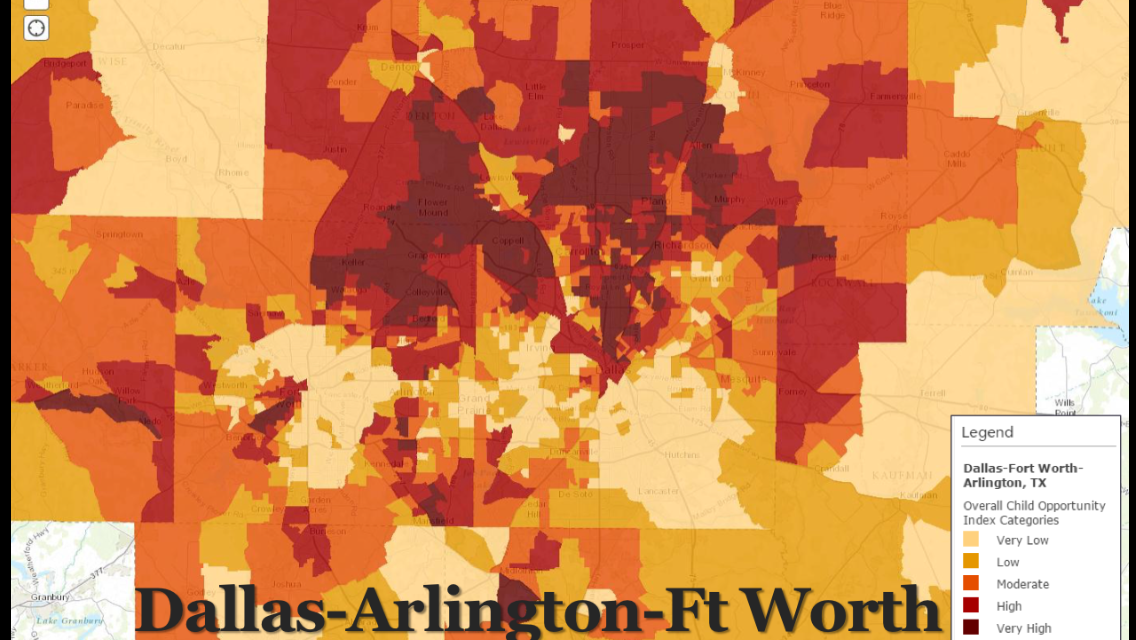
A map of loss of life span (i.e. years of life lost per racial group) compiled by Parkland, when compared to a 1937 HOLC map, illustrates the long-lasting effects of a policy that was enacted more than 80 years ago. A Kirwan Institute map measuring child opportunities in the Dallas-Fort Worth area shows similar results.
The HOLC was disbanded (having done its mandated job) in 1936 and was replaced with Federal Mortgage Association. Those clauses that restricted the sale of a home to white people only was ruled unenforceable by courts by the Supreme Court in 1948. Redlining officially (although it still finds its way into policy in various forms) ended in 1968 with the adoption of the Fair Housing Act. But those post-Depression redlining maps continue to shape neighborhoods in Dallas and other cities to this day.
(For a look at an annotated Dallas HOLC map laid over a current map of Dallas for reference, click here and click “OK” on the error message about surface water.)


a very interesting article. would love to know if the Kirwan Institute has done similar analysis of Northern cities
Yes! A complete list of cities they’ve mapped and studied so far is here. They’ve only just started on Dallas, so it is not included on the list.
My mother, Helen Carter Peters Blaw, was a founding member of the Greater Dallas Housing Opportunity Center from 1970 to 1972. They brought suit against illegal redlining ban\sk. I stuffed and licked a lot of envelopes for fundraising. My mother was often used as the “shill” to ask for a loan with the same credit information as a POC. She would get the loan, and the POC would be turned down. The only difference was skin color. She unfortunately died of a brain tumor in 1972. OH, what the good she could have done had she lived. She was a bridge builder and a fighter. We need more Helen Carter Peters Blaws these days.
I am an architect specializing in zero-energy design. I am out marching for justice, equity, fairness, and democracy. I write and call my congresspeople almost daily to meet my mother’s legacy and make a difference.