Dueling Market Forecasters: Who’s Right?
Share News:

Depending on your source, the Dallas housing market is either doomed or the outlook is relatively rosy. But which one is right?
CoreLogic is the often-quoted source for real estate market forecasting. We’ve all read their pessimistic predictions for the coming year. To review, currently, CoreLogic forecasts that from May 2020 to May 2021, home prices will decline in all states an average of 6.6 percent and 5.9 percent in Dallas. This is a significant increase from April’s forecast when Dallas was only projected to drop 2 percent in price and March’s 1.8 percent year-over-year decline.
Reading recent reports from (unknown to me) Veros Real Estate Solutions are much cheerier. Veros generates reports and forecasts for lenders, investors and appraisers for the top 100 markets nationwide. They’re also “the primary architect and technology provider of Fannie Mae and Freddie Mac’s Uniform Collateral Data Portal (UCDP).”
As part of their promotion of their VeroFORECAST product, the company issues a quarterly forecast covering their top 10 strongest and 10 “least performing” markets along with a rollup of how the nation as a whole is expected to perform. To see how the remaining 80 markets are forecast to perform, one must subscribe.
I looked back before COVID-19 to their fourth quarter 2019 forecast for the coming year along with those issued for the first and second quarters of 2020. Unlike many other reports during this time, Veros never speculated that real estate was going to be a driver of recession as it was back in 2008.
4Q2019: Calm Before The Pandemic
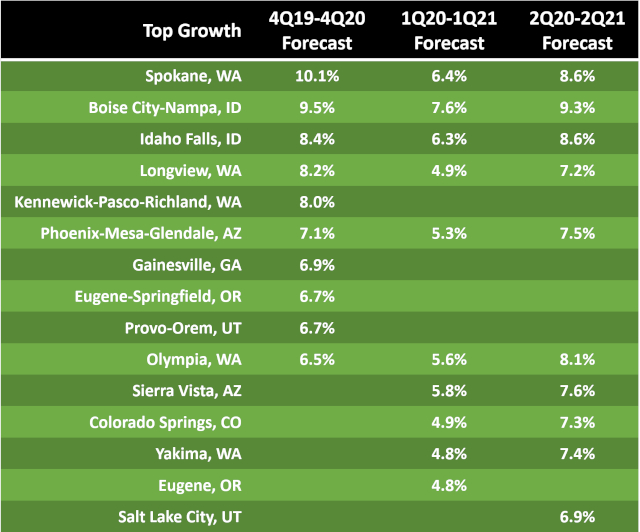
Back in the carefree fourth quarter of 2019, Veros’ forecast for 2020 posited that nationally, the top 100 markets would appreciate an average 3.9 percent with the top 10 markets averaging 7.8 percent growth. Their rationale was the severe housing shortage in the Pacific Northwest, home to eight of the 10 markets.
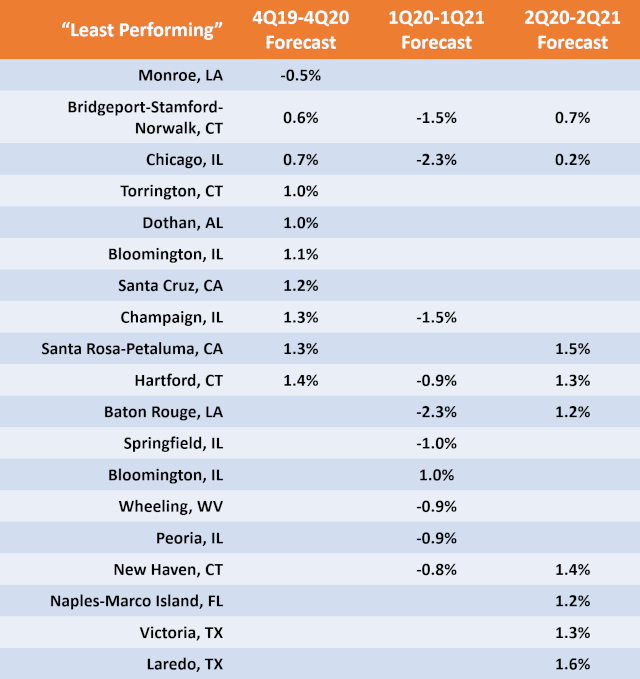
At the bottom, only Monroe, Louisiana, was projected to decline (by half of 1 percent) while the remaining nine would still grow between 0.6 and 1.4 percent. Their rationale was that the $10,000 limit on state and local taxes Trump imposed hurt high-priced markets as did slowing or declining population growth.
With just one of 100 metros reporting declines, it’s important to note that during this period there was a 9.6 percent swing between the first and last market (Spokane, Washington’s 10.1 percent growth versus Monroe, Louisiana’s negative half percent).
1Q2020: The Fear Bubble
Their most pessimistic forecast was issued for 1Q2020 to 1Q2021 with a nationwide average gain (yes, gain) of 1.9 percent (positively rosy compared to other reports). At the lowest end, Baton Rouge and Chicago tied for worst performing markets at a 2.3 percent decline. Their 10th “least performing” market was New Haven, Connecticut, being down 0.8 percent by 1Q21. The remaining 90 metros tracked were forecast to see some price gains.
However, the top 10 markets were still projected to gain between 4.8 and 7.6 percent over the year. Similar to the prior forecast, the top performers were in areas with pronounced housing shortages (even worse than Dallas).
What’s most interesting about these two quarters of data are the differences in the “top 10” listings. Over the space of three months, four of 4Q2019’s top 10 wouldn’t make it to 1Q2020, while of the bottom 10, six wouldn’t carry over. Why?
Of the top 10, it says that those who were dropped would grow less than the 4.8 percent lowest score of the first quarter forecast. With the exception of the drop of Gainesville, Georgia, and pick-up of Colorado Springs, Colorado, the remaining three drops/adds fit the earlier criteria of low housing inventory. Given the massive rise in unemployment at the time, I expect the other defining factor was how well they’d survive job loss and recovery.
Of the bottom 10, many seem to be heavier into manufacturing or what the report called “slow-growth” markets in addition to being in states with stagnant/declining populations.
During this quarter, the spread between the top and bottom metro declined by 45 percent showing a flattening market endemic of a more wait-and-see attitude. The resulting 5.3 percent growth average that forecast 10 of 100 metros measured would have price declines over the following 12 months was 10x higher than the prior forecast.
2Q2020: Panic Recovery
Veros’ second quarter forecast showed a marked bounce back, forecasting prices will increase 3.5 percent nationally, while in the top 10 markets, a 7.8 percent average increase is forecast by the end 2Q2021. Comparing those numbers against the pre-pandemic forecast of two quarters ago (3.9 and 7.9 percent growth respectively) and It’s almost as if COVID-19 didn’t happen – at least to real estate.
Of the top 10, the appreciation spread is 2.4 percentage points (Salt Lake City’s 6.9 percent against Boise City-Nampa, ID at 9.3 percent projected growth). The bottom 10 have all returned to growth ranging from Chicago’s flat 0.2 percent to Laredo, Texas’ 1.6 percent. In fact, outside Chicago and Bridgeport, Connecticut, all top 100 markets are forecast to grow at over 1.2 percent.
But as noted in the report, large metro areas can have pockets of weakness or strength. For example, Veros calls out New York City’s borough of Manhattan expecting prices there to decline by 2.2 percent (driven by a glut of ultra-luxury condos) whereas surrounding boroughs are predicted to rise by 3.5 percent by 2Q2021.
Big Bucket Rationale
As the story has unfolded, massive unemployment is projected to disproportionally impact the rental market. Coupled with a decade of underbuilding, low interest rates and low for sale inventory it’s classic supply and demand.
Veros’ forecasting seems to be leveling off too – at least in the top 10 markets where just one market was added/subtracted (Eugene, Oregon out, Salt Lake City, Utah in). At the bottom end, half of the ten are replacements from the first quarter (with Santa Rosa-Petaluma, California the only metro on either list to make a return from the 4Q2019 list – for what it’s worth).
These adds and subtracts are part of any forecasting that takes multiple types of data into account. For example, a city may have a housing deficit which drives up prices but the main employer announces their abrupt departure. Rosy red suddenly turns to … well, brown.
CoreLogic sees the same indicators but interprets them differently.
Comparison Shopping: Veros vs CoreLogic
For Veros, Dallas is part of the great paid-for middle 80 metros. What this means is that Veros’ forecasting criteria never saw Metroplex home prices declining. This flies in the face of CoreLogic’s past three months of acceleratingly dour forecasts that have nearly tripled their projected price declines from March through May 2021.
Last month I reported that a slew of projects on Turtle Creek can’t get out of the ground – quite a few likely due to problems securing financing. It seems clear their lenders aren’t Veros customers.
Who’s right? Time will tattle.