Dallas Tax Revenue in 3-D And Other Interesting Maps
Share News:

I never realized DCAD’s boundaries create a great big bug.
Last week, Robert Mundinger over at TheMap showcased the work of his friend Owen Wilson-Chavez who’d created a 3-D map of tax revenues generated across the DCAD taxing area. During my self-guided tour, I discovered a bunch of other, equally interesting, maps. It’s Dallas like you’ve never seen it …
Above, you can immediately see the unsurprising fact of Southern Dallas not contributing much money in property taxes to the city’s coffers. But it’s more nuanced than that. First, pretty much all the green you see are concentrated areas of commercial real estate. Below the Park Cities “white spot” is downtown and Uptown. To the right is the Central Expressway corridor with the North Park Shopping Center area being the tallest green. Beyond that there’s Galleria, Preston Center and the commercial space bordering LBJ and Central Expressway. The lesson here is that higher density generates more taxes than it costs in services.
How much more?
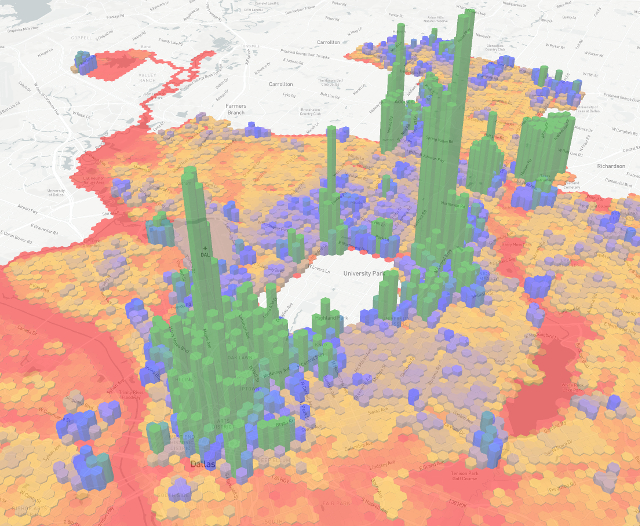
The green you see is commercial (the no-tax red splotches are Trinity River on left and White Rock Lake on right)
As noted, these “emerald cities” of taxation gold are overwhelmingly populated by high-density commercial high-rises. Parcel-wise, Dallas Central Appraisal District reported in 2017 that commercial parcels accounted for 9 percent of DCAD’s total of 830,163 parcels. Residential made up 651,499 of those parcels. Revenue-wise, commercial accounted for 33 percent of total DCAD tax revenue while residential accounted for 60 percent. Seeing these numbers, you can better see why tall, high-density commercial are tall green on the map – they pay 33 percent of taxes but account for only 9 percent of land parcels (and still pay pennies). You can also understand the much lower bars and less-green within largely residential areas. They pay a large percentage of taxes overall, but take up a sprawling 78 percent of the land parcels.
So when you say that Southern Dallas contributes much less than Northern Dallas, remember, there isn’t a single green area of commercial density (jobs). It also illustrates why transportation from Southern Dallas to better jobs in the north is a big issue. It’s certainly part of the reason residential real estate values and tax contribution are low south of I-30. Of course another reason is the abundance of empty lots owned by the city or investors waiting for a rebirth to commence.
We talk a lot about the potential for gentrification around Fair Park, but it’s been happening for a long time. The revitalization of the area has been teed-up for so long, it’s given developers and investors plenty of time to snatch up property on the cheap and sit on it until the city gets off its ass (as it seems to be on the verge of finally doing). When I wrote about Southern Dallas housing, the area surrounding Fair Park, (especially south) had the most empty lots. That’s not to say the city shouldn’t protect those who live there from being priced or taxed out. But it illustrates the change coming to the area.

More people, more retail and restaurants, and more vibrancy
Density Brings Vibrancy
While not 3-D, this map shows the distribution of multi-family condo units. As you can see, the highest concentrations are in Oak Lawn and Uptown. What area of Dallas are people flocking to? These most vibrant areas. I’m sure if you overlaid rental multi-family onto this, the picture would be crystal clear on density equaling vibrancy. As you’ll see below, it’s these kinds of developments that also hike the value of property. You can also see in Southern Dallas there are almost none outside the Cedars. That will have to change.

Green left-right are Preston Center and North Park commercial areas
Preston Hollow Blue
The blue colors are another (literal) level down the tax contribution scale. This is where high- and mid-rise multi-family enters. In fact, just north of the Park Cities bubble, the “center” patch of lower green and blue columns is the area between the Pink Wall and Hillcrest. Residentially, it outstrips the rest of Preston Hollow in tax revenue generation per parcel because of its multi-family building density. On the left of the above picture, the only area that comes close are the large-lotted mansions of Old Preston Hollow (west of the North Tollway and north of Northwest Highway).

The Southern Opportunity
What will happen when Fair Park starts attracting business and residents to the surrounding area? Revenues from property taxes will shoot up. Even if the city protects existing homeowners, imagine tax revenues doubling or tripling or more? Far fetched? Actually very conservative. Think about it — vacant land generates almost no taxable revenue, especially in an area of low value already. What happens when a $10,000 lot suddenly sprouts three townhouses selling for $300,000 each? That’s 90 times growth in value for one lot. And trust me, with the amount of vacant land available, it won’t be single-family that’s built. Look at Uptown. Psychics and used car lots gave way to high-density commercial and residential, not single-family homes. Southern Dallas doesn’t need a Ritz-Carlton, but middle class development would be a boon for the city and revitalize the area with good housing and most importantly, jobs.

The lighter the red, the darker the lungs
Smoking And Diabetes Around Town
Another of TheMap’s maps shows prevalence of smoking around the city. In a broad stroke, essentially the wealthier (more northern) you are, the less likely you are to smoke. Or put another way, those least able to afford an expensive habit, indulge the most. Dovetailing that is the incidence of diabetes which also skews south. Poor people have diets that are higher in sugar and lack proper medical care.

Planned Development Districts
When you’re buying a property, it’s good to know if it’s in or near a planned development district (PD). There are nearly 1,000 in Dallas today and what they allow (and don’t) can be very important. I’ve written a lot about the Oak Lawn Committee, which oversees the vast PD-193, and the current goings-on within PD-15 (sub-section of the Pink Wall).
Using this map, you can just click on the area and see what the PD number is and its boundaries. Then it’s off to the City Attorney’s office to read what the PD is all about.
You see? Maps are wonderful things that can help visualize data in different ways. Some of the map data above isn’t surprising once you think about it, but some will be. Hopefully the city has predictive tools to guide them towards the best solutions for the city. If they don’t, they should visit TheMap (and bookmark it).

Remember: High-rises, HOAs and renovation are my beat. But I also appreciate modern and historical architecture balanced against the YIMBY movement. In 2016, 2017 and 2018, the National Association of Real Estate Editors recognized my writing with three Bronze (2016, 2017, 2018) and two Silver (2016, 2017) awards. Have a story to tell or a marriage proposal to make? Shoot me an email [email protected]. Be sure to look for me on Facebook and Twitter. You won’t find me, but you’re welcome to look.